| Sankyo Frontier Co., Ltd. |
| |
| |
| Standard Market of the Tokyo Stock Exchange code : 9639 |
| Takatsugu Nagatsuma, President |
| 5 Shintoyofuta, Kashiwa, Chiba, Japan 277-8539
Phone +81-4-7133-6666
Fax +81-4-7131-3289 |
| Production, sales and rental of modular buildings, self storage, multistory parking devices, plant factory |
| 1,622 * (Excluding temporary employees, directors, and corporate auditors)
* As of March 2026. |
|
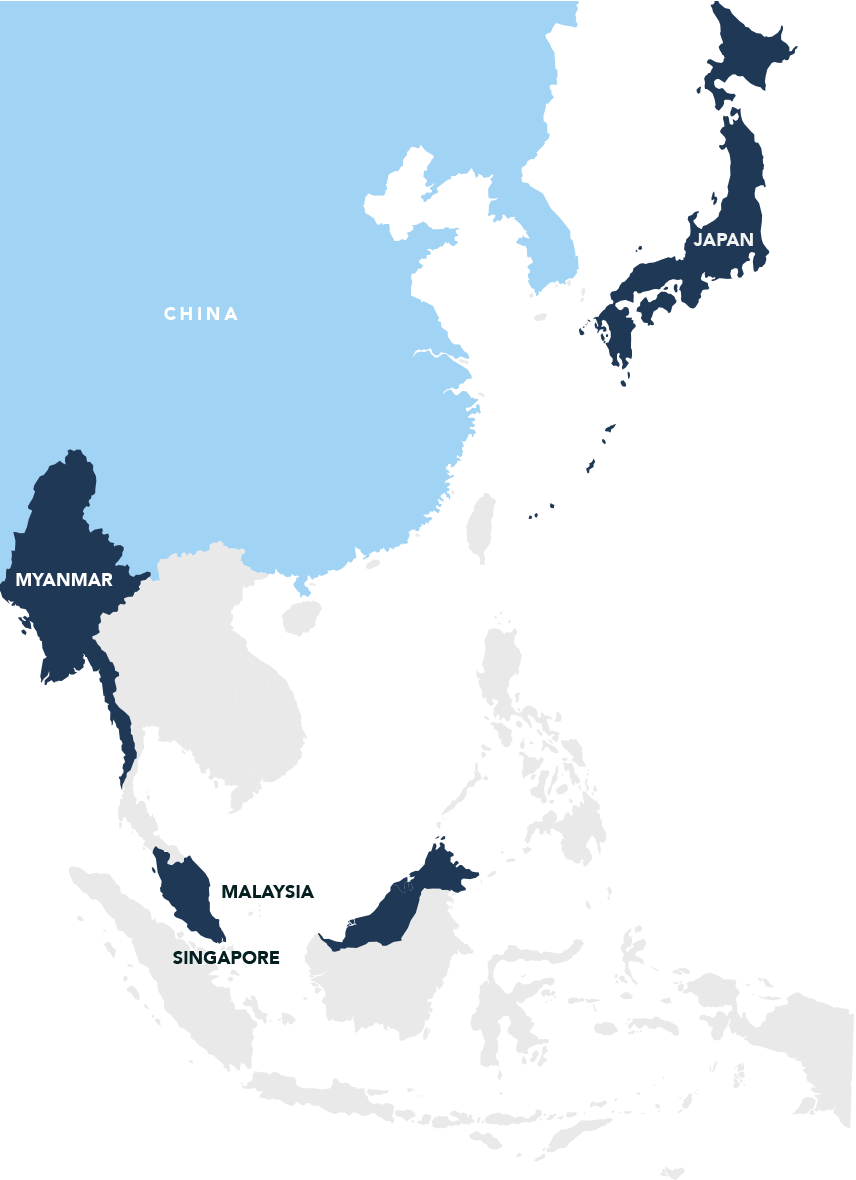
- 広州番禺三協豪施有限公司
- Sankyo Frontier Myanmar Co., Ltd.
- Sankyo Frontier Malaysia Sdn. Bhd.
- Sankyo Frontier Technologies Myanmar Co., Ltd.
- Sankyo Frontier USA Inc.
- Sankyo Frontier Singapore Pte. Ltd.
|
|
- Sankyo Frontier Co., Ltd. Singapore Branch
- Sankyo Frontier Co., Ltd. – Philippines Branch Office
|
|
- Chiba Bank, Ltd.
- MUFG Bank, Ltd.
- Higashi Nippon Bank, Ltd.
- Sumitomo Mitsui Banking Corporation
- Mizuho Bank, Ltd.
- Mitsubishi UFJ Trust and Banking Corporation
|